Search data is a gold mine for marketing strategy
Search data reveals a lot about what consumers want and can inform on how to position a brand for growth and even what words will work best in a campaign.
 By Grace Kite
 For the first time this autumn, a number of marketers that work on big brands and think about strategy and positioning, emotion and nuance have had a look at search data.
Previously it had typically only been used by that other type of marketer. The type who chooses keywords, buys search ads and optimises websites for SEO.
And guess what? The big brand, big budget marketers have found it very exciting. Because – as Les Binet and James Hankins have shown – share of search is related to share of voice and sometimes it can even predict market share.
It’s hugely useful, but still it only scratches the surface of what there is to learn from search data. When people search, they type in what they want or need, and often, what they’re willing to pay for.
The data that those searches generate builds to nothing less than a full and detailed description of what economists call demand, or in other words, what it’s possible to sell.
This means that search data is a gold mine for marketing strategy. It reveals which types of product are most in demand and which aspects of them are most important to consumers. It can inform on how to position a brand for growth and even what words and tone will work best in creative executions.
Share of search as currently proposed only goes so far
That’s not to say pulling Google trends for your brand name and that of your most important competitors to see who’s getting the most searches isn’t useful. It quite clearly is.
Share of search gives a quick read on how in demand your brand is versus theirs, and that’s a handy yardstick for how well you’re doing. And yes, if advertising is working to generate demand, it will generate searches too, so share of search – just like brand consideration – can give you a read on how your campaign landed.
But it doesn’t take into account the supply side of the purchase decision, and that’s a problem if you want to use it to say anything about whether a marketing investment is or was worth making, or what size your budget should be.
Understanding the ‘art and science’ of share of search
A search for your brand indicates some willingness to purchase from you, but it doesn’t tell you how much people are willing to pay, or which product features they need. You can be an in-demand brand, with a high share of search, but if the price is wrong, that demand won’t convert to a sale.
Les Binet does, of course, understand this. In his talk at EffWeek in October, he introduced the chart below. It shows how, in his example category of cars, conversion from share of search to market share depends heavily on the price different brands charge.
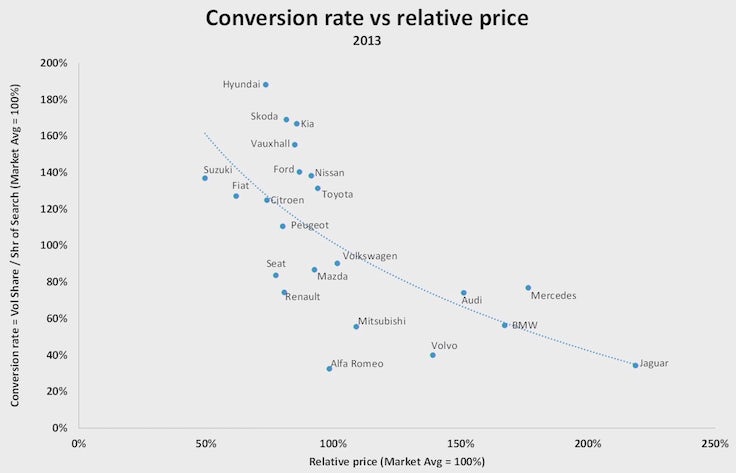 Source: Les Binet via IPA
 Source: Les Binet via IPA
Nowhere is this caveat more important than in categories where the majority of search does not include a brand name. Here, people’s first thought is to survey what different businesses can offer them before coming to a clear idea of who they prefer to buy from.
The strength of individual brands of course plays a part, but it’s only one factor considered equally alongside the price, the product, the delivery mechanism and so on.
More research is needed, but my bet is the role of the supply side, and particularly how it plays out when the first search is unbranded, is important.
It may explain why share of search – which only takes into account branded demand – is predictive of market share in some categories but not in others (according to Byron Sharp).
Share of search for different ‘pools of demand’ in the category
But understanding share of voice and market share isn’t the only objective of marketing research. Consulting CMO Pascal Moyon and I have been collaborating on uses for search data in marketing strategy and execution.
For this, it isn’t only the brand names that people search for that are useful. Even more interesting are the other words people put into that search bar. Each one is a description, straight from consumers’ keyboards, of what they want.
If you collect together a year’s worth of searches in a given category, you get a huge volume of words from a huge number of searches – all available in the public domain.
The next step is to group searches that have similar keywords or which lead to similar types of purchases to reveal distinct pools of demand. This yields a different version of share of search. One that doesn’t just track how you’re doing. It tells you where and how to focus attention for sales growth.
 For example, in the chart above, which buckets searches in the gifting category, we can see straight away that most people looking for a gift put in something like ‘mum’s birthday’ or ‘father’s day’. The second biggest category is day trips organised around activities, where people search for ‘track day’, ‘spa day’ or ‘photo shoot’.
There are, of course, learnings here for search engine marketing and SEO. The biggest bar in the chart above has the obvious implication that website indexing and PPC campaigns should, in most cases, be organised around person plus occasion combinations.
But equally important are the available insights around product strategy and positioning. For example, a brand with expertise in weekend breaks – which only get 1% of searches – might be able to profitably supply day trips, which get 18%.
And gifting brands with hotel partnerships might be able to profitably use the fact that, within the 18%, ‘spa day’ is most often searched, but ‘afternoon tea’ is second biggest and growing quicker.
 There are clues for creative development too. In gifting, the words ‘warm’ and ‘cosy’ appear often in the anniversary gifts bucket. And in the website building category, shown below, people put the words ‘design’ and ‘create’ into Google much more often than techy functions like ‘server’ or ‘host’.
Searches for phrases like ‘make money’ or ‘publish my business’, which might seem like the obvious end benefit for having a website are very rare.

Which pools are winnable, and how?
Once demand pools have been identified and sized, and a brand has examined their capability to fulfil demand there profitably, it’s important to assess how winnable each pool is. A quick and easy thing to do first is to look at the share of search in each pool that includes a brand name.
In many categories, journeys that start with a branded search are harder for a competitor to win, and in some, diverting people from their initial choice of brand is almost impossible. In footwear, for example, the demand pool that is ‘Nike trainers’ is well defended via years of loyalty building investment by Nike, and however big that pool is, it’s a hard one for anyone that’s not Nike to fish.
It’s possible, with a bit of additional data science, to see which competitors are strongest in each demand pool. This is because, again, the data about which website people visit following a search is in the public domain. This step saves our brand from fighting for a pool that someone else owns, and identifies promising pools where our brand has a foothold that could be the basis for growth.
Then it’s back to business economics and marketing effectiveness to understand how. For many big brands, the right strategy to fish the promising pools is likely to include advertising, price and product changes, so that econometrics designed around specific demand pools is the right tool.
For smaller ecommerce brands, attribution, A/B testing and light, agile econometrics can go a long way towards knowing what to do next.
And for the future, marketers in both camps will continue to have a lot to learn from each other. The work that Les Binet and James Hankins have done is useful in itself, but its potential is greatest where it acts as an example of knowledge-sharing at the corner of the two marketing communities. That corner is fertile ground that all of us should be exploring.
Grace Kite is managing director at Gracious Economics